Buyer / consumer
DevCheck AI
Trust Score + AI analysis + IP reputation + shareable device certificate. Check a phone before you pay for it. 7 MB.
Features →PerfMonitor is a ~7 MB non-root Android tool for game and performance engineers. It reads the real SurfaceFlinger per-frame timestamps, plus CPU / GPU / DDR frequency and load, power, thermals, memory — surfaces them as a floating overlay while you play, and exports CSV and XLSX reports with methodology notes baked in. No host, no wires.
Three apps in the DevCheck family, three different jobs. Same team, same 84K-device reference database behind the scenes.
Trust Score + AI analysis + IP reputation + shareable device certificate. Check a phone before you pay for it. 7 MB.
Features →15-dimension raw dump of everything Android will surface. For privacy audits and anti-fraud research. Tiny APK.
Viewer →Live floating overlay: real per-frame FPS, jank, CPU / GPU / DDR, power, thermals. CSV + XLSX exports with methodology attached. 7 MB.
What it measures ↓Numbers with defined semantics — every metric on the overlay has the same definition in the export report.
Reads SurfaceFlinger's per-frame present timestamps directly. Not estimated, not sampled — the actual frame time the compositor logged.
A frame is jank when its render time exceeds 2× the trailing 3-frame average AND >83.33ms. BigJank crosses 125ms. Idle stretches (menus, loaders) are excluded from stats — they don't get miscounted as stutter.
Mean of the worst 1% frame intervals (captures peak pain) and the 1% percentile frame (unaffected by extreme spikes, reflects overall level). You get both, always.
Per-cluster CPU frequency and per-core utilisation. GPU frequency + load (Qualcomm kgsl / MediaTek gpufreqv2 auto-detected). DDR memory bus frequency (Qualcomm / MediaTek / Xring branches).
Live current × voltage → instantaneous power draw, plus per-frame average energy. Battery temperature and memory usage. Values a SoC doesn't expose show as `-` and don't fake an empty chart.
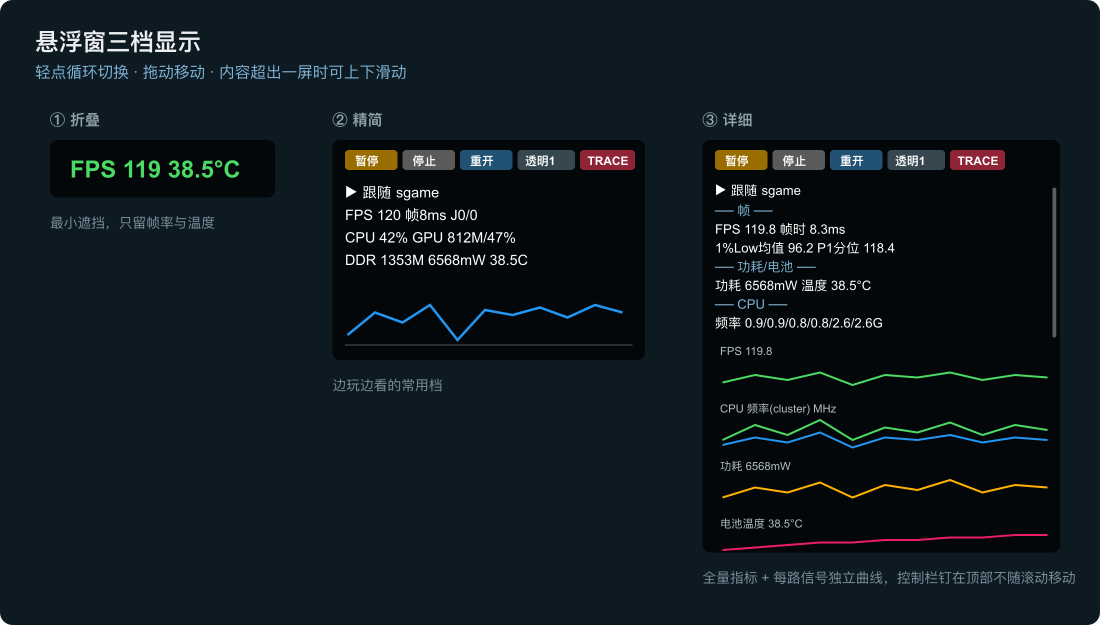
Tap to cycle: Compact (fps + temp only) → Slim (4 rows + FPS curve) → Detailed (all metrics + 8 independent curves). Four opacity levels; the highest strips the backdrop so it doesn't cover the game.
FPS, CPU cluster frequencies, per-core utilisation, GPU freq/load, DDR freq, power, battery temp — each a separately-coloured line. Missing signals just don't render.
Capture a 10-second system-level Perfetto trace straight to disk. No adb, no host tools — just the button in the overlay.
Compact for a passing glance, Slim for the smoke test, Detailed when you need every curve at once. The control bar pins to the top so it doesn't scroll away with the content; four opacity levels, highest strips the backdrop so nothing covers the game.
Every metric ships with the exact rule used to compute it. No mystery numbers when you paste a stat into a bug report.
Three sections — Session / Aggregate / Raw. Every metric carries its unit and a methodology note. UTF-8 with BOM so Excel opens it clean.
Aggregate cells are live Excel formulas, not baked numbers. You can re-run the math or change the aggregation rule in the sheet itself.
Files land in Download/PerfMonitor/,
visible to any file manager, and shareable via the system share sheet.
The metrics live in places the untrusted_app
SELinux domain has no access to: SurfaceFlinger frame timestamps, /proc/stat,
cpufreq / kgsl sysfs nodes. PerfMonitor ships a built-in Shizuku server
to lift itself to adb-shell privileges — no third-party manager app needed, and no root required.
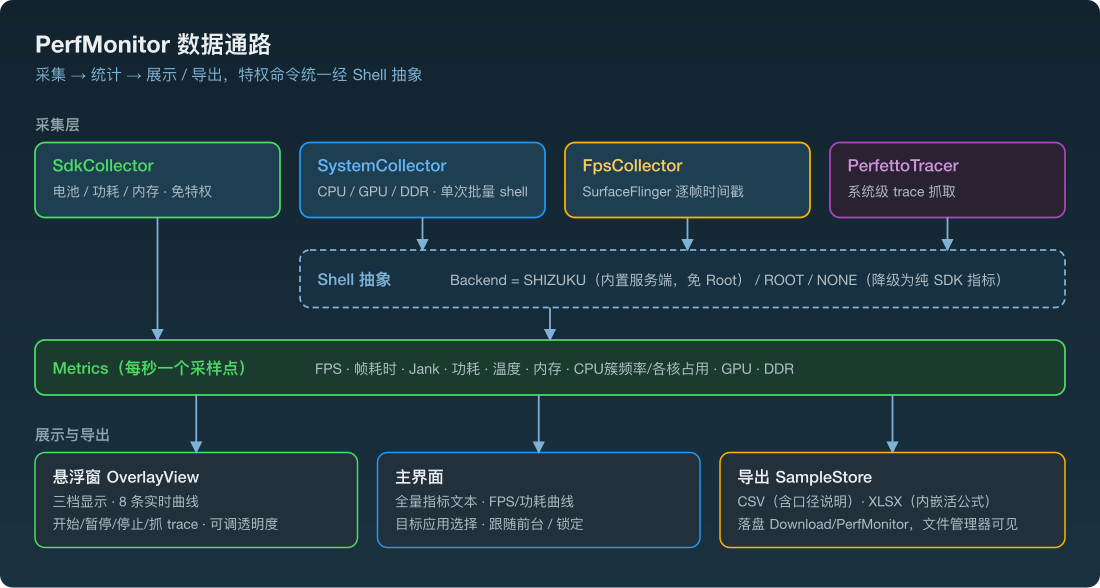
Built-in ADB pairing client. Enter the pairing code from Developer Options right in the app. Whole flow happens on the phone — no computer required.
Rooted devices launch the server directly, and get extra metrics from nodes only readable in the root domain.
Without activation, the app degrades gracefully — power, temperature, memory and other pure-SDK metrics still work.
| SYSTEM_ALERT_WINDOW | Show the live overlay on top of the game |
| FOREGROUND_SERVICE | Keep collecting while the game is foregrounded |
| QUERY_ALL_PACKAGES | Populate the target-app picker |
| POST_NOTIFICATIONS | Persistent notification for the foreground service |
Nothing is uploaded, ever. All collection, statistics and file writing happen on-device. Exports live in local storage under your control.
com.android.perfmonitorVerify integrity after download:
shasum -a 256 perfmonitor-v0.1.0-demo.apk
# should output the SHA-256 above, exactly7 MB, non-root, no host tools. On-device wireless-debug pairing, live overlay, CSV + XLSX exports with methodology attached.